The months when outages hit the hardest in 2025
Some years begin with a bang. For outage reports, 2025 began more like a low hum and then steadily turned up the volume.
Across the year, Status Is Down recorded 10,214 reported outages, but they were far from evenly distributed. Some months saw fewer disruptions, while others experienced a much heavier concentration of downtime reports across websites, apps, platforms, and online services.
As the year unfolded, a broader pattern emerged. The opening months gradually gave way to a more active summer period, and that higher level of outage activity continued into the final months of 2025. The monthly ranking shows when reported disruptions were most concentrated.
July Rose Above The Rest
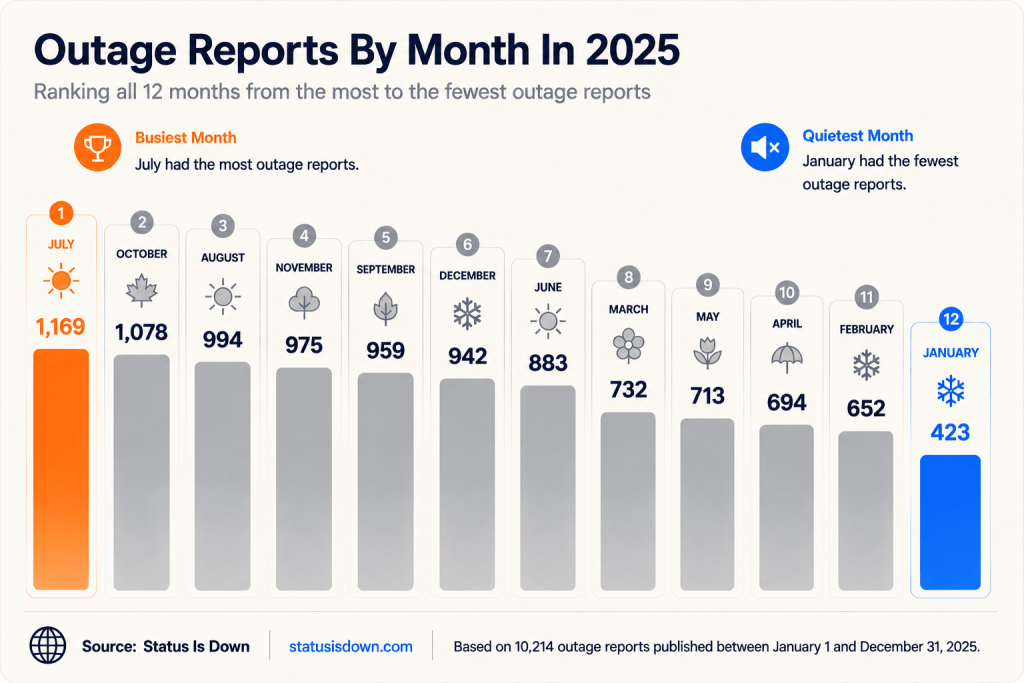
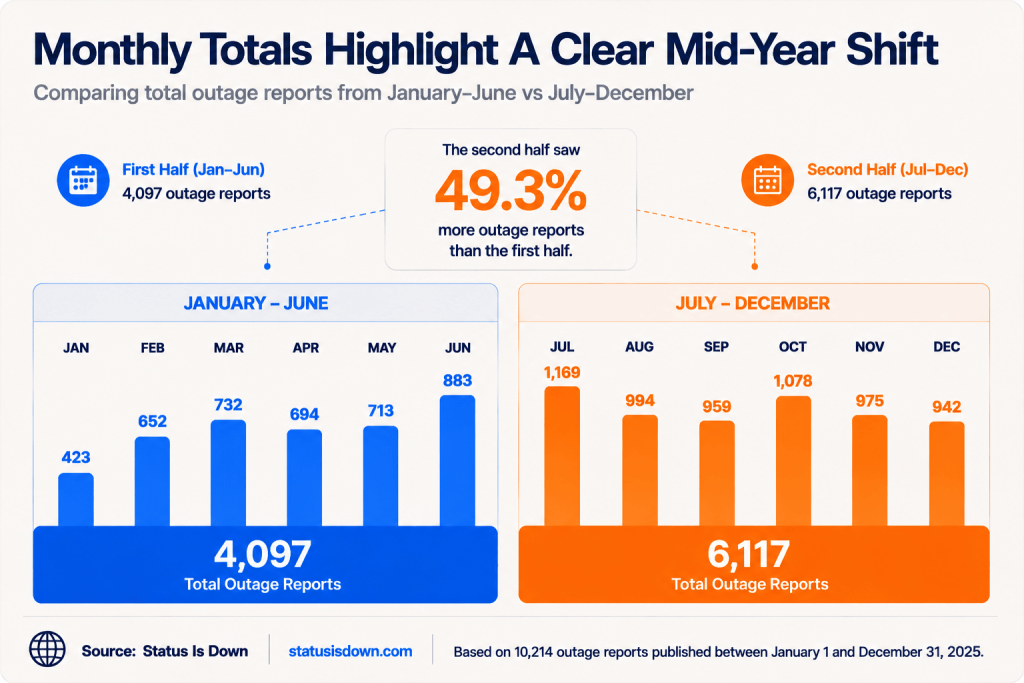
July recorded 1,169 outage reports, the highest monthly total in 2025 and equal to 11.45% of the annual total. October followed with 1,078, while August ranked third with 994.
The gap between the two ends of the calendar was considerable. July recorded 746 more outage reports than January and nearly 2.8 times as many. The remaining months in the top six also came later in the year, with November, September, and December completing a ranking made entirely of second-half months.
After July’s peak, monthly outage totals eased slightly but remained elevated. August and September dipped from the summer high, October climbed again, and the final two months still recorded far more reported disruptions than the beginning of the year.
The Road To July Was Not A Straight Line
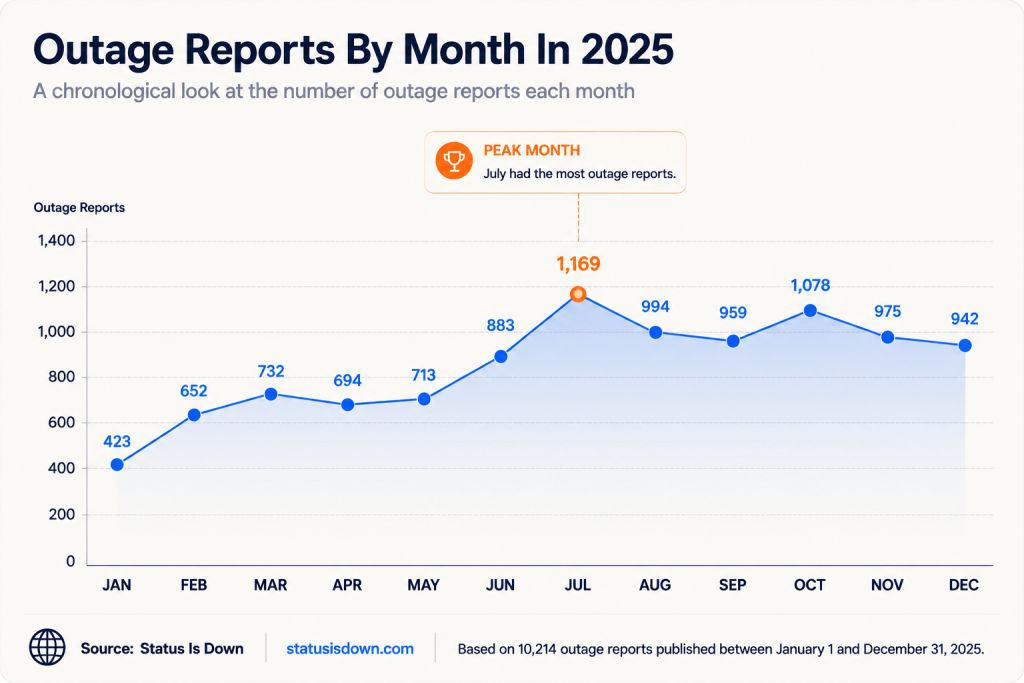
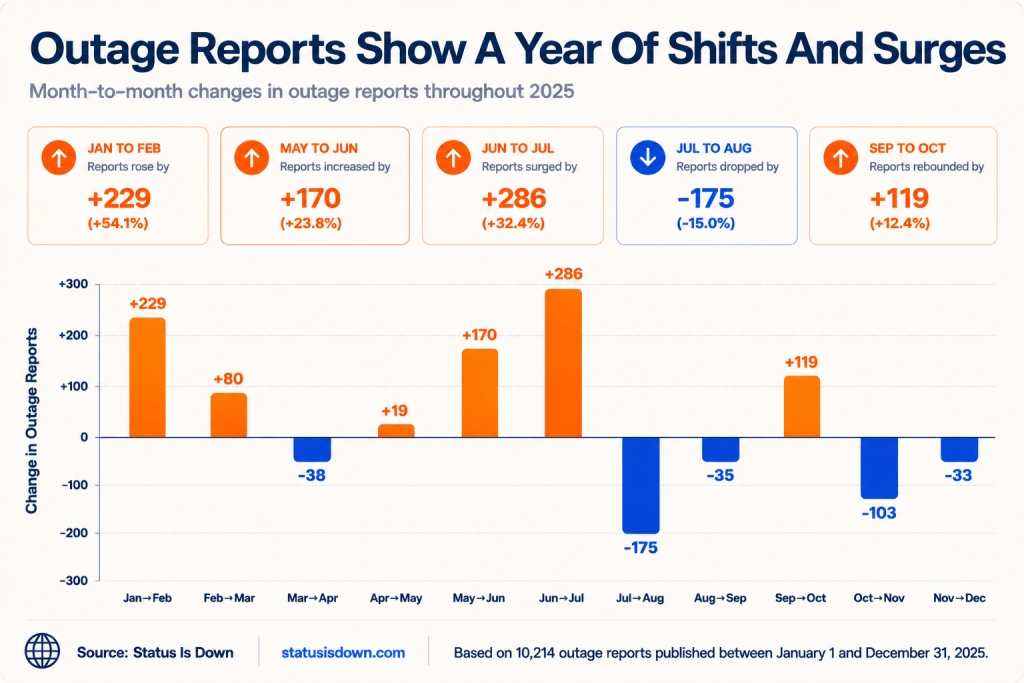
The first noticeable jump came early. Reports rose from 423 in January to 652 in February, an increase of 229 or 54.1%. March climbed again before April brought a modest dip, followed by another rise in May.
The strongest acceleration came as spring gave way to summer. Reports increased by 170 from May to June, then added another 286 in July. Across those two steps, the monthly total grew by 456 reported outages.
July’s peak was followed by the steepest decline of the year, with August falling by 175 reports to 994. September slipped slightly further before October changed direction and rose by 119 to 1,078, the second-highest monthly total of 2025.
November and December softened again, but neither returned to January’s lower levels. By the end of the year, monthly outage activity had settled at a noticeably higher level than where it started.
The Second Half Carried More Of The Load
The first six months produced 4,097 outage reports. The second half generated 6,117, or 49.3% more.
Nearly three in every five reported outages from the year occurred between July and December. The difference was not driven by July alone. Every second-half month recorded more outages than January through May, while June was the only first-half month to approach the later totals.
The comparison shows a clear divide in 2025. The first half built gradually, while the second half maintained a heavier flow of reported downtime even after the summer peak passed.
Telecom Services Led, But Gaming Stayed Close Behind
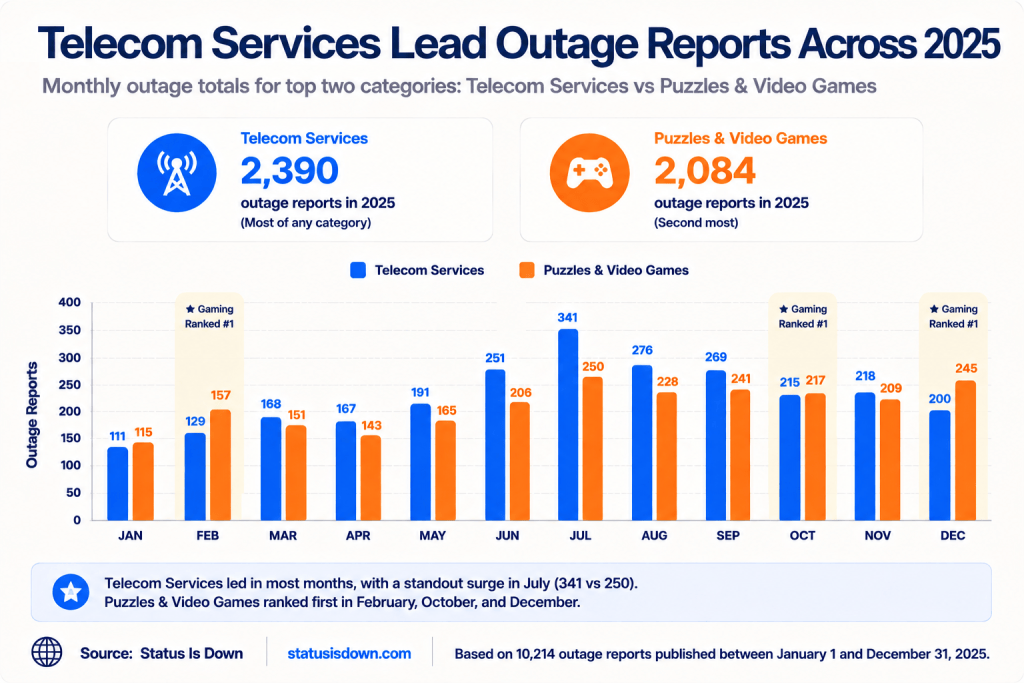
Telecommunications and internet services recorded 2,390 outage reports across 2025, the highest total among all categories. Puzzles and video games followed closely behind with 2,084, while banking and finance recorded 790.
Telecom outages remained the most common source of reported downtime throughout the year, affecting the connections people rely on for everyday activities. July was the category’s busiest month, with 341 reports compared with 250 for puzzles and video games.
Gaming, however, had several months where it moved ahead. In February, gaming recorded 157 outage reports compared with telecom’s 129. It edged ahead again in October with 217 reports against 215 for telecom, before widening the gap in December with 245 reports compared with 200.
The numbers show two major areas where people felt online disruptions most often. Telecom services accounted for the largest overall share of reported outages, while gaming platforms saw several spikes that reshaped the monthly rankings.
Spectrum Dominated, While Other Services Took Their Turns
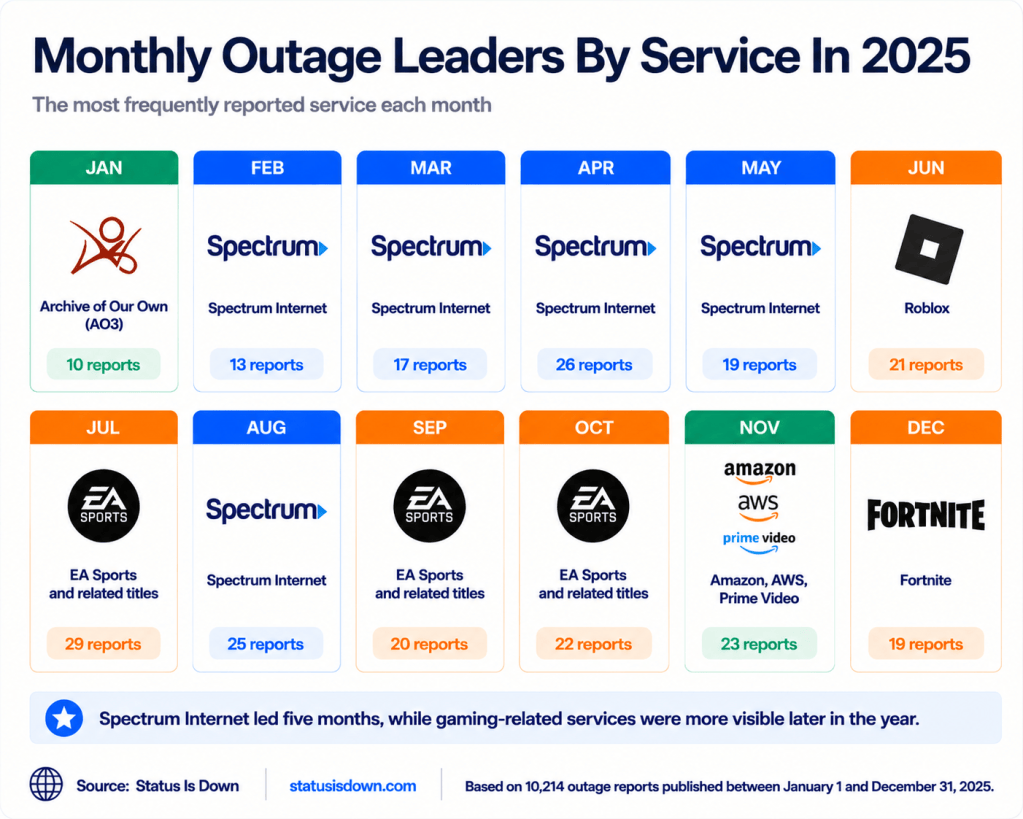
Individual services showed a more varied pattern throughout the year. Spectrum Internet recorded the highest number of monthly outage reports most often, appearing at the top in five months from February through May and again in August. Archive of Our Own saw the most reports in January with 10, while Roblox reached the highest count in June with 21.
Gaming services became more noticeable during the middle and later months of the year. EA Sports and related titles, including games such as EA Sports FC 26, Madden NFL, and College Football, recorded the most outage reports in July, September, and October. July’s 29 reports marked the highest monthly total for any individual service in 2025. Amazon, AWS, and Prime Video recorded the most reports in November with 23, while Fortnite finished the year with the highest December count at 19.
The monthly rankings showed how quickly outage patterns could shift. While connectivity providers appeared most often, gaming, streaming, and online platforms each had their own moments when downtime became more noticeable.
How the Numbers Were Counted
This analysis covers 10,214 outage reports published as Status Is Down forum topics from January 1 through December 31, 2025. Reports were grouped by their Eastern Time publication month and reviewed by broad category and individual service.
The figures reflect outages reported on Status Is Down. They are not a count of independently confirmed technical incidents or the total number of users affected.