
Up by Default: What 186,056 Popular Websites Reveal About Readiness Across Industries
Presented by Status Is UP, the uptime-enablement sister platform of Status Is Down. Industry whitepaper, October 2026.
Status Is Down records what happens when websites and online services fail. This paper looks at the decisions made long before an incident: how a site handles HTTPS, certificates, email authentication, caching and DNS. Those choices rarely make headlines, but they help decide whether a routine fault stays invisible to customers or becomes a visible outage, a browser warning, a convincing phishing email or a slow, fragile page.
The evidence comes from the Status Is UP Website Readiness snapshot. Between 23 and 24 October 2026, Status Is UP checked the homepage of 207,755 popular websites once each against 31 practices, grouped into four lanes: Enable (discoverability), Harden (security and trust), Accelerate (speed) and Recover (resilience). After excluding 21,699 adult, gambling and piracy sites, 186,056 results are published. The median site scores 64 out of 100 on the readiness index.
The snapshot is not an uptime measurement. It records which practices could be observed on one day, from one vantage point. A practice that was not observed is not, on its own, a security finding: many practices are optional, and some sites reach the same goal in other ways.
Executive summary
- Platform beats popularity. The top 1,000 sites have a median readiness index of 67; sites ranked between 500,000 and one million score 64. Website platforms span 16 points, from 76 on Shopify to 60 where no platform was detected.
- Security work often stops halfway. 90.8% of sites redirect HTTP to HTTPS, but only 30.8% keep HSTS for at least a year. 68.7% of domains have either no DMARC policy or a monitor-only one.
- Regulated sectors harden; consumer sectors accelerate. Insurance and banking lead the Harden lane (64 and 62) but trail on speed. E-commerce leads Accelerate (69). Government services have the lowest median index of 30 industries (56) and an Accelerate score of 44.
- Certificate lifetimes are a 2027 deadline. One certificate in four (24.8%) lasts more than 100 days, the maximum allowed from 15 March 2027. In insurance, banking and government the share is above 60%.
- DNS is highly concentrated. Only 10.6% of sites spread their nameservers across more than one provider. One provider, Cloudflare, answers DNS for 35.4% of the sites measured.
- Long-term commitments are rare. Of 138,176 sites where five low-cost “set it and keep it” practices could all be measured, 198 (0.14%) show all five and 42.4% show none.
The four lanes behave very differently. Discoverability basics are widespread, security is mixed, speed depends heavily on hosting, and resilience at the DNS layer is the exception.
1. Platform defaults matter more than popularity
It is tempting to assume that the most visited websites are the best prepared. The snapshot shows only a small difference. The median readiness index is 67 for the top 1,000 sites, 66 for sites ranked up to 5,000 and up to 10,000, and between 64 and 65 for every band from 50,000 down to one million. Across all seven popularity bands, the spread is 3 points.
The platform underneath a site moves the score much more. Among platforms with at least 900 sites, Shopify storefronts have a median of 76 (13,085 sites), Next.js on Vercel and Webflow 73, Next.js on Cloudflare 72, Adobe Experience Manager 71, and Magento 70. WordPress, the largest platform in the sample with 30,664 sites, has a median of 64. PrestaShop and Bitrix sit at 61, and the 115,524 sites with no detected platform at 60.
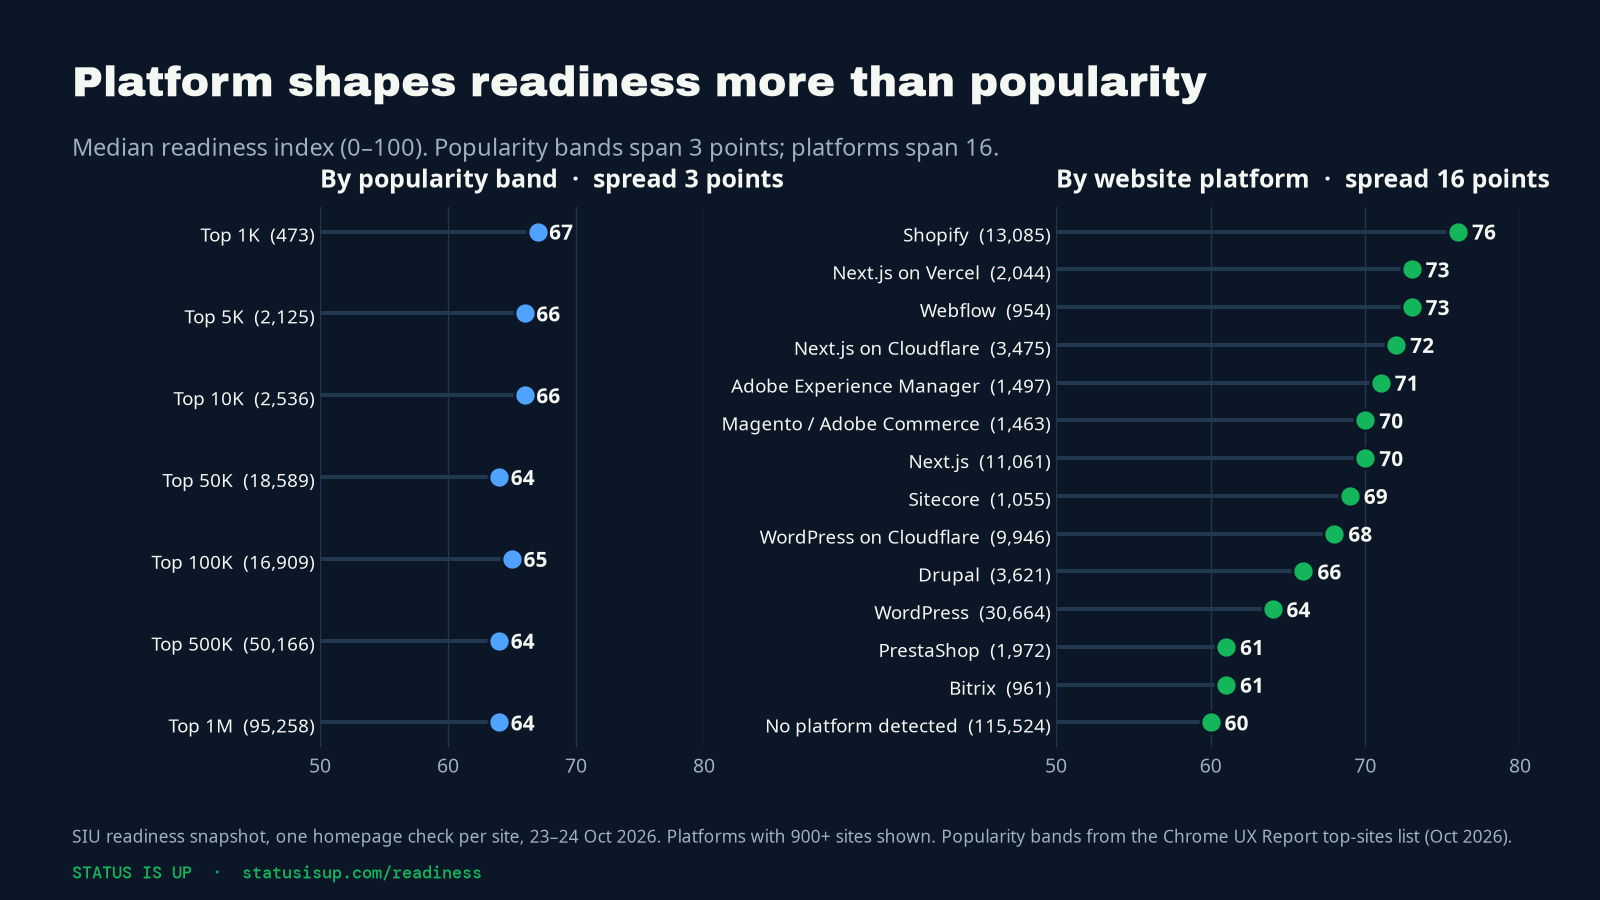
The reason is defaults. A hosted platform makes many decisions on the owner’s behalf. On Shopify, 95.7% of storefronts negotiate HTTP/3 and 98.2% send the nosniff security header. On Next.js sites hosted by Vercel, 97% keep HSTS for at least a year. On WordPress the same rates are 38% for HTTP/3, 22.3% for HSTS and 29.1% for nosniff, because each owner, theme and host decides separately.
Defaults also set ceilings. 12,350 Shopify storefronts send exactly the same HSTS lifetime, 7,889,238 seconds, or about 91 days. That is below the one-year threshold used by Status Is UP and by the browser preload list, so only 3.7% of Shopify sites pass the HSTS check even though almost all of them redirect to HTTPS. When a platform chooses a value, nearly every site on it inherits that value.
The pattern holds inside a single industry. Among e-commerce sites, 10,109 Shopify stores have a median of 76, Magento and Next.js stores 70, stores with no detected platform 66, WordPress stores 64 and PrestaShop stores 61.
Popularity changes the mix of practices rather than the total. Top 1,000 sites are far more likely to enforce DMARC (60.5%, against 24.1% for sites ranked between 500,000 and one million) and to publish a security.txt file (21.5% against 4.6%). But they are less likely to use certificates of 100 days or less (50.3% against 82.3%) and less likely to expose a sitemap the checker could find (41.8% against 74.6%). Platform-level results are published on the Status Is UP platform benchmarks, including Shopify, WordPress, Next.js on Vercel and Webflow.
2. Security that stops halfway
The most common pattern in the snapshot is a first step taken and the second step skipped. HTTPS is nearly universal: 90.8% of sites redirect plain HTTP requests to HTTPS. HTTP Strict Transport Security (HSTS), which tells browsers never to try the insecure version again, is much less common. Of the 144,624 sites where HSTS could be measured, 48.0% send the header at all, 30.8% keep it for at least a year, 18.4% also cover their subdomains and 9.6% meet the technical conditions for the browser preload list. Among sites that already redirect to HTTPS, half (50.2%) send no HSTS header.
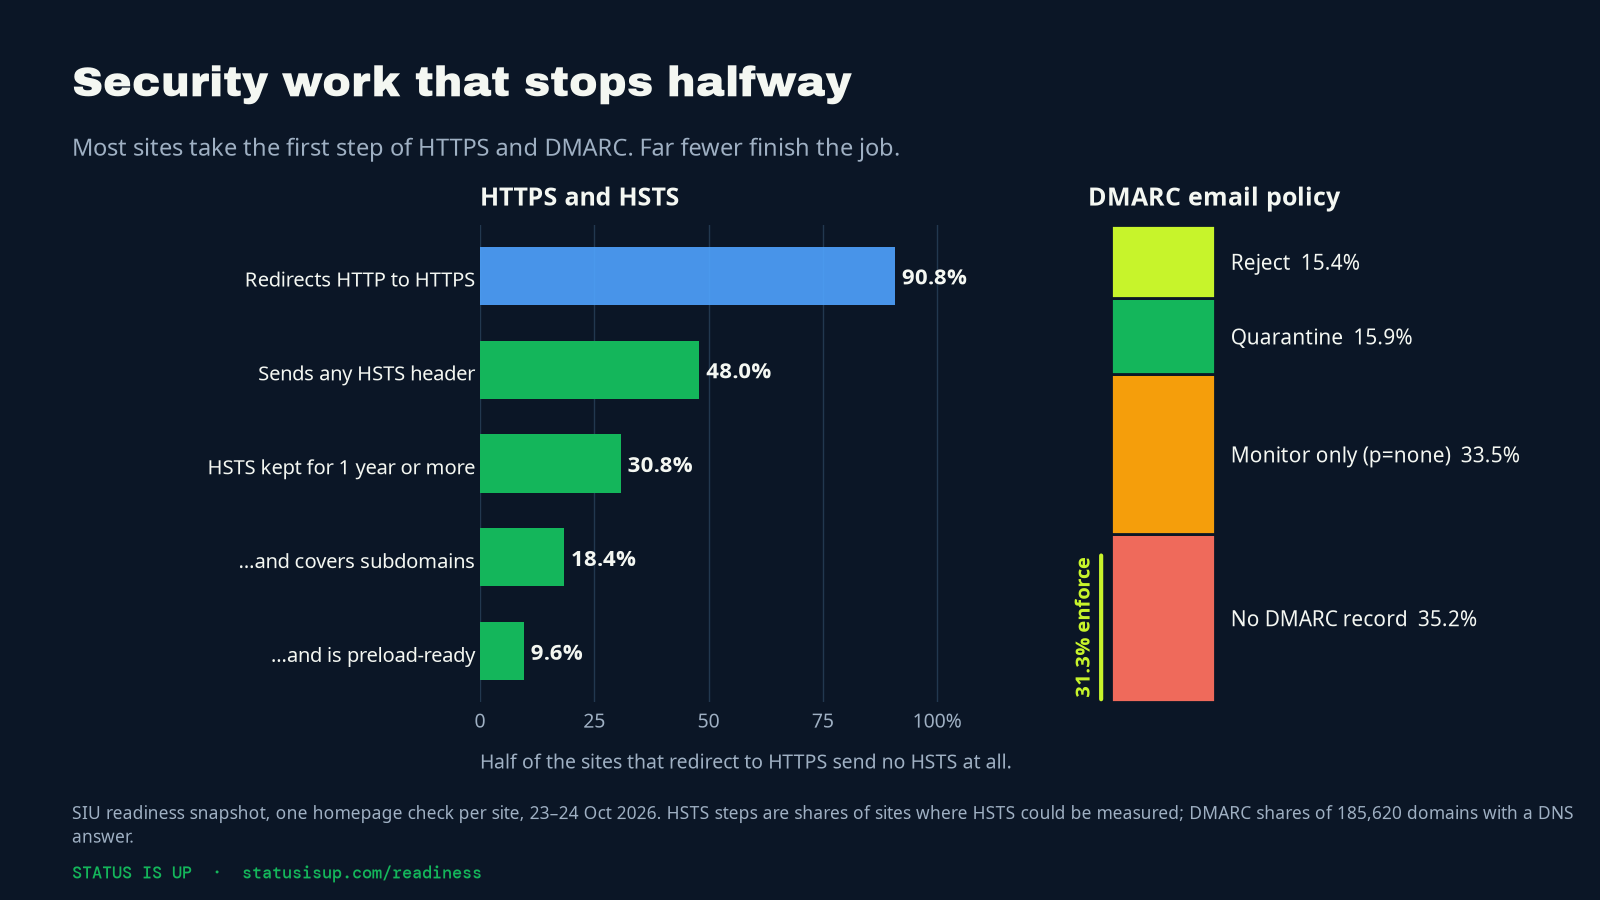
Email authentication shows the same shape. Of 185,620 domains, 35.2% publish no DMARC record and 33.5% publish a monitor-only policy (p=none). Only 31.3% enforce a policy: 15.9% quarantine suspicious mail and 15.4% reject it. A monitor-only policy is a sensible starting point, but it does not stop anyone from sending mail that claims to come from the domain. Google requires SPF, DKIM and DMARC from bulk senders to Gmail, and recommends email authentication for every domain that hosts a public website.
Neither step is hard to finish, but both need care. The HSTS preload project recommends raising the HSTS lifetime in stages, from five minutes to a week to a month, before committing to a long value, and it describes preloading itself as optional. Status Is UP is rolling out HSTS on statusisup.com in the same staged way. For DMARC, the usual path is p=none with reporting, then quarantine, then reject, once every legitimate sender is aligned. See the HSTS and DMARC guides for the exact steps.
3. Regulated sectors harden. Consumer sectors accelerate.
Across the 30 industries with at least 900 classified sites, readiness profiles split along a clear line. Sectors with regulators and auditors lead the Harden lane: insurance and financial planning (64), banking and finance (62) and stock and crypto trading (59). They also lead on the commitments auditors tend to ask about. Insurance enforces DMARC on 62.9% of domains and banking on 61.4%, against 31.3% overall. Government services lead on DNSSEC (19.4%) and on multi-provider DNS (21.4%).
The same sectors trail on speed. Banking scores 55 in the Accelerate lane and insurance 57, while e-commerce scores 69 and news and media 65. Government services stand out, with a median index of 56, the lowest of the 30 industries, and an Accelerate score of 44. Only 17.5% of government homepages serve modern image formats, 13.3% negotiate HTTP/3 and 31.6% pass the asset-caching check.

Consumer sectors show the opposite profile. E-commerce sites are fast and easy to discover (Enable 87, Accelerate 69), but only 24.9% keep HSTS for a year and 26.2% enforce DMARC. That gap matters in a sector whose customers routinely receive order, payment and delivery emails.
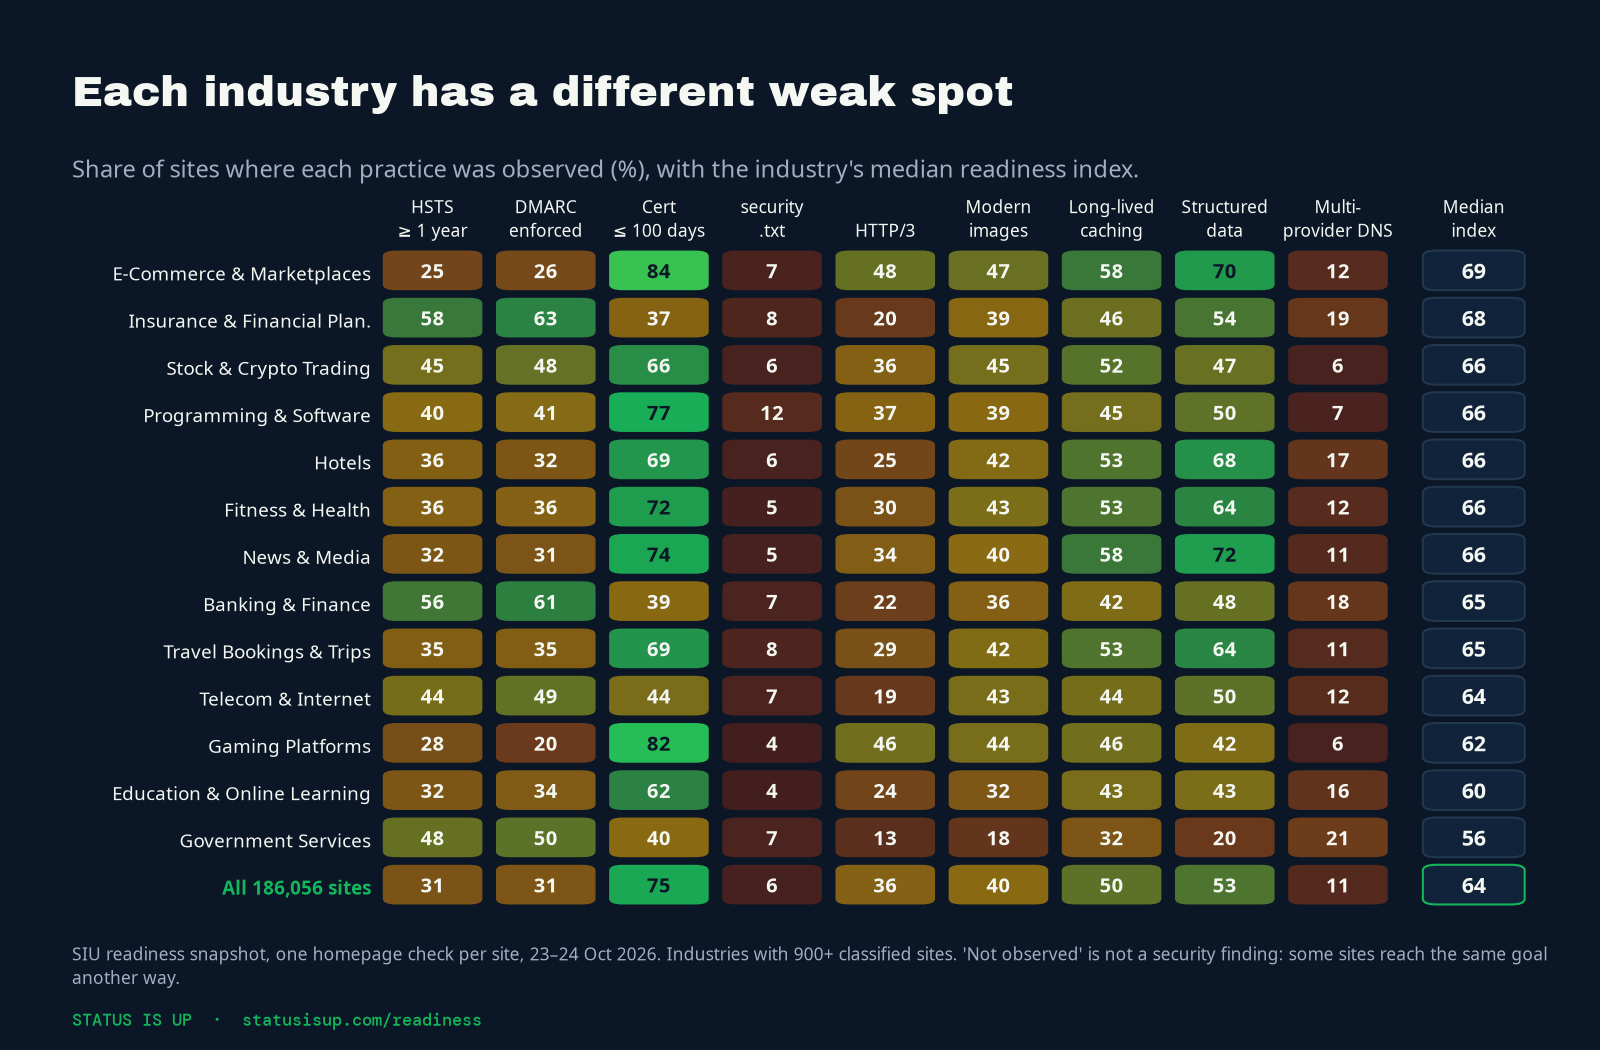
No industry is ahead on every practice. Each has a different weak spot, which is why a single cross-industry checklist is less useful than knowing the two or three practices an industry usually misses. The playbook later in this paper lists them, and every industry has its own page, for example e-commerce and marketplaces, banking and finance and government services.
4. Certificate lifetimes are about to shrink
In April 2025 the CA/Browser Forum, which sets the rules for publicly trusted TLS certificates, adopted Ballot SC-081v3. It shortens the maximum certificate lifetime in steps: 200 days from 15 March 2026, 100 days from 15 March 2027 and 47 days from 15 March 2029. The period for which a certificate authority may reuse a completed domain validation falls to 10 days by 2029.
Most of the web is already prepared for the next step. Of the 179,988 certificates measured, 74.9% lasted between 48 and 100 days and 0.3% lasted 47 days or less. But 24.8% lasted more than 100 days, and 8.0% more than 200 days, which means they were issued under the earlier 398-day limit.
The exposure sits in the sectors that score best on Harden. More than 60% of certificates last longer than 100 days in insurance (62.8%), banking (60.8%) and government services (60.2%), and 56.5% do in telecommunications. In e-commerce the share is 16.1%, and among web tools 10.0%.

The difference tracks how certificates are issued. Let’s Encrypt and Google Trust Services, which issue through the automated ACME protocol, account for 73.1% of the certificates measured, and virtually all of their certificates in the sample lasted 100 days or less. In e-commerce, 80.7% of certificates with an identified issuer come from these two. In insurance the figure is 33.9%, in banking 37.2% and in government 37.9%, where commercial authorities such as DigiCert and Sectigo are more common.
A long-lived certificate is not a fault today, and many come from managed services that renew automatically. The risk is a manual renewal process. At 47 days, a certificate has to be replaced roughly eight times a year, which only works when issuance and deployment are automated. Organisations with long-lived certificates should confirm before March 2027 that every public certificate renews without a person in the loop. Publishing a CAA record, which names the authorities allowed to issue for a domain, is a natural companion step; only 10.6% of sites have one. The certificate lifetime and CAA guides explain both.
5. One DNS provider, one point of failure
DNS is the first dependency of every visit. RFC 2182 (BCP 16) recommends that a zone’s secondary nameservers be placed so that no single failure removes them all, ideally on separate networks and in separate locations. In the snapshot, 10.6% of the 184,676 sites where this could be measured use nameservers from more than one operator.
Concentration is high. Cloudflare answers DNS for 65,293 sites, 35.4% of those measured, and 0.1% of them also use another operator. Amazon Route 53 serves 17,216 sites, of which 0.7% use a second operator. The exceptions are telling: 13.2% of Akamai Edge DNS customers and 56.9% of NS1 customers spread their nameservers across providers. Government services are the most diversified industry, at 21.4%.
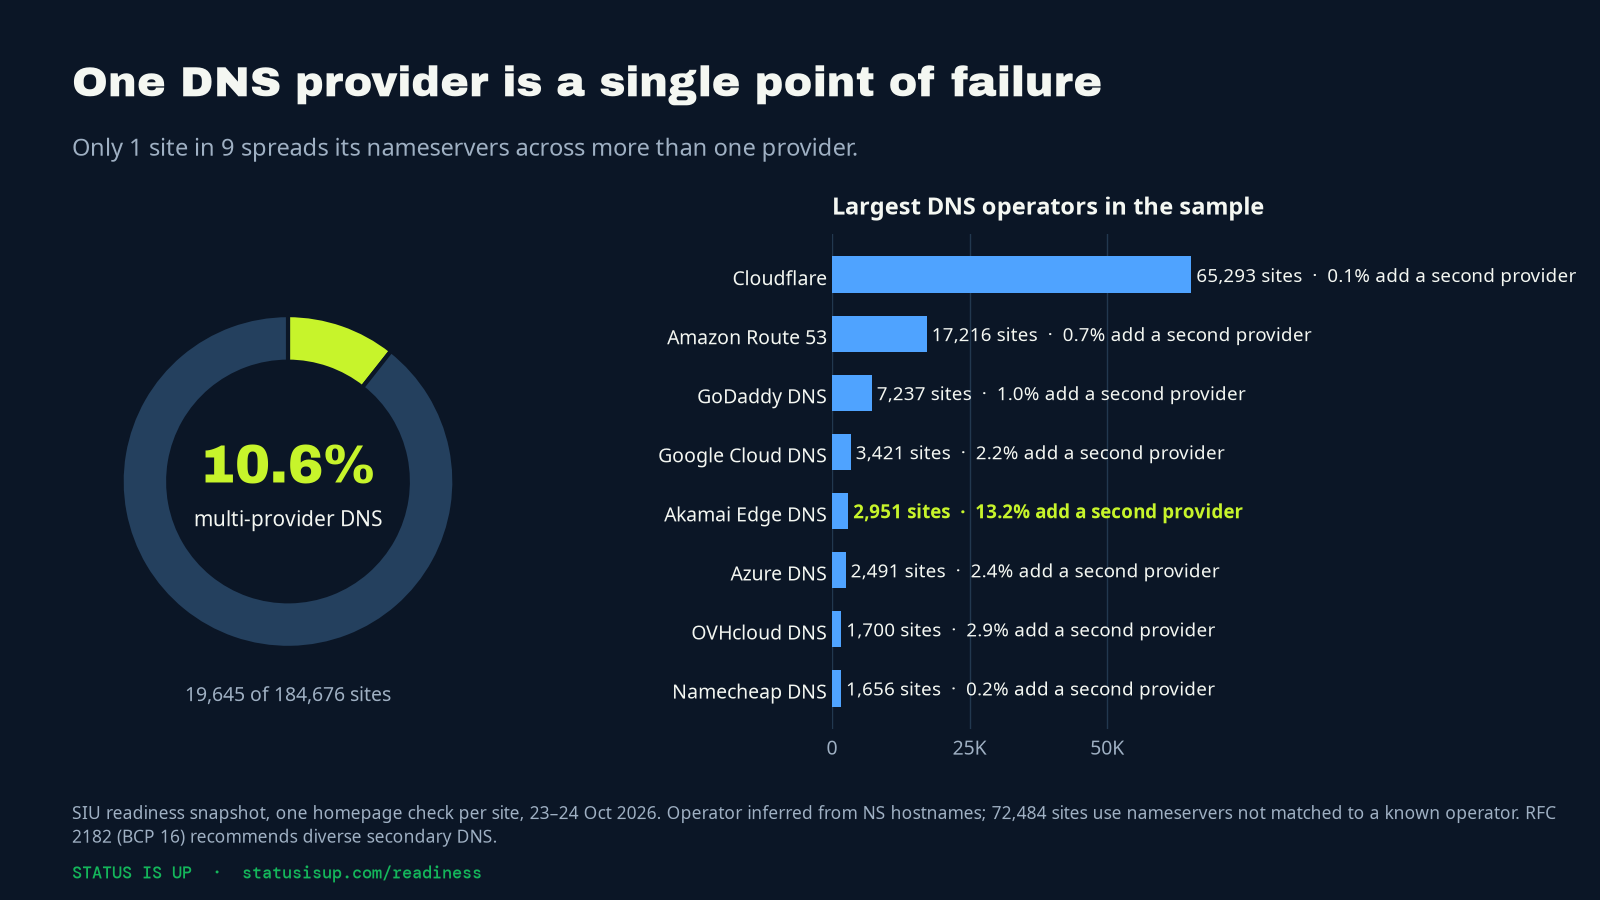
Single-provider DNS is a reasonable choice for many sites, because large DNS providers are highly redundant inside their own networks. But it means that a provider-wide incident, or a configuration mistake at the provider, becomes an incident for every site that depends on it. Status Is Down’s earlier whitepaper, When ‘Down’ Is Not ‘Gone’, describes how to design graceful degradation for exactly that kind of concentrated dependency. On the Status Is UP side, the DNS diversity guide and the dependency continuity planner help owners decide whether a second provider is worth it.
6. The rarest result: all five long-term commitments
Some practices are cheap to add but need an owner to keep them true: HSTS kept for a year, a CAA record, an enforced DMARC policy, a security.txt file that tells researchers how to report a problem, and nameservers at more than one provider. Of the 138,176 sites where all five could be measured, 42.4% show none of them. Only 198 sites, 0.14%, show all five. Even among the top 1,000 sites, 6 of the 264 where all five could be measured show all five.
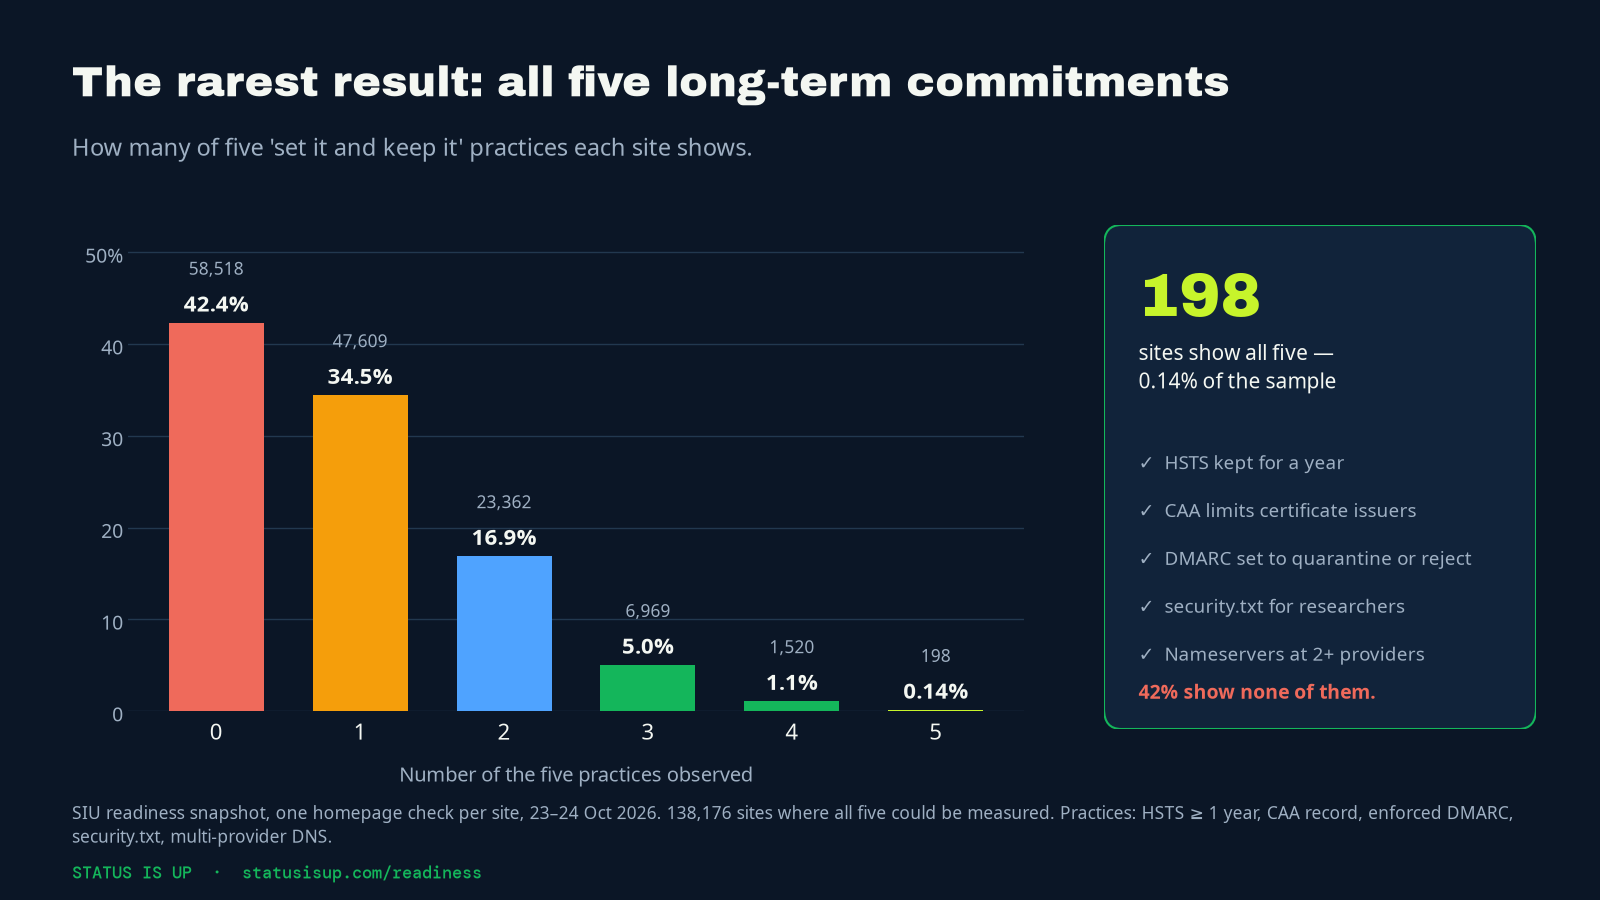
The individual rates explain why. security.txt, defined in RFC 9116, appears on 5.5% of sites, CAA records on 10.6% and multi-provider DNS on 10.6%. None of them requires new infrastructure, but each requires someone to decide, publish and maintain it. A security.txt file even carries an expiry date by design, so it has to be renewed.
An industry playbook
The table lists eight large industries with the practices that are least often observed on their sites, which are usually the cheapest place to start. Figures in brackets are the share of sites in that industry where the practice was observed.
What this means for website owners
- Find out what your platform already does. Run the free Status Is UP readiness check on your own domain, then compare it with your platform and industry benchmarks. The quickest wins are often settings your platform supports but you have not switched on.
- Finish the security you started. If you already redirect to HTTPS, add HSTS and raise its lifetime in stages. If you publish DMARC at p=none, read the reports, align your senders and move to quarantine, then reject.
- Automate certificates before 15 March 2027. List every public certificate, its issuer and how it renews. Anything renewed by hand will not survive a 47-day limit.
- Decide on DNS concentration on purpose. Either add a second DNS provider or record the single-provider decision with a tested recovery path. The website recovery plan is a free template for that conversation.
- Publish the cheap commitments. A security.txt file and a CAA record take minutes to publish and are visible signals that someone owns the site’s security.
For background on each practice, the Status Is UP wiki guide to uptime readiness and the daily Did you know? series explain them in plain language.
What this means for Status Is Down users
Status Is Down tracks outages as people experience them, through user reports and realtime signals across thousands of services. Readiness sits upstream of those reports. It does not predict outages, and this snapshot did not measure availability. But several of the practices in this paper shape how a failure is felt. A site with nameservers at two providers can stay reachable during a provider incident. An automated certificate cannot expire unnoticed and greet visitors with a browser warning that looks like an outage. An enforced DMARC policy makes it harder for anyone to send convincing email in the domain’s name while customers are waiting for news.
Website pages on Status Is Down now link to a free Status Is UP readiness check for the same domain, so owners who find their site in the Status Is Down catalog can review the practices that are within their control.
Methodology and limits
- Sample. Websites in the Status Is Down website catalog matched with the Chrome UX Report top-sites list (October 2026 release). 207,755 sites were checked; 21,699 adult, gambling and piracy sites were excluded, leaving 186,056 published results. The list under-represents regions where Chrome is less common.
- Measurement. One check per site between 23 October 2026, 11:25 UTC, and 24 October 2026, 01:59 UTC, from a single vantage point. The homepage was fetched once (up to six redirects and 3 MB), with the response headers of one same-site stylesheet or script and the DNS and certificate details needed for each check. robots.txt was honoured, using the user-agent token StatusIsUPReadiness.
- Scoring. Each practice is recorded as observed, not observed or not measured. Not measured never counts against a site. The readiness index is the weighted share of measured practices that were observed, from 0 to 100. Lane scores and industry figures are medians and shares of measured sites.
- Classification. Industries use Status Is Down’s catalog categories at high or medium confidence; this paper shows the 30 industries with at least 900 sites. Platforms, CDNs, DNS operators and certificate authorities are inferred from response headers, page markup, nameserver hostnames and certificate issuers, and can be missed or misattributed.
- Limits. The snapshot covers homepages only, on one day. It does not measure availability, response times or change over time. A practice that was not observed is not a security finding.
- Data. The full method is on the readiness method page, and segment-level results can be downloaded as the October 2026 benchmarks dataset (CSV).
Conclusion
The readiness of the web is decided less by fame than by defaults. A small store on a well-configured platform can be better prepared than a household-name site that has never revisited its headers, certificates or DNS. The gaps in this snapshot are mostly configuration, not infrastructure: finishing HSTS and DMARC, automating certificates before the 2027 limit, and deciding deliberately whether one DNS provider is enough. Each is a change an owner can make this quarter, and each makes the next incident a little less likely to reach customers.
Status Is UP will repeat the snapshot so that these figures can be tracked over time. Website owners can check their own site now.
Sources
- Status Is UP: Website Readiness snapshot, October 2026
- Status Is UP: How the readiness checks work
- Status Is UP: Readiness benchmarks dataset, October 2026 (CSV)
- CA/Browser Forum: Ballot SC-081v3, Introduce schedule of reducing validity and data reuse periods
- CA/Browser Forum: Baseline Requirements for TLS server certificates
- HSTS Preload List Submission
- Google Workspace Admin Help: Email sender guidelines
- RFC 6797: HTTP Strict Transport Security (HSTS)
- RFC 7489: Domain-based Message Authentication, Reporting, and Conformance (DMARC)
- RFC 8659: DNS Certification Authority Authorization (CAA) Resource Record
- RFC 9116: A File Format to Aid in Security Vulnerability Disclosure (security.txt)
- RFC 2182: Selection and Operation of Secondary DNS Servers
- Chrome UX Report top-sites lists (CrUX top lists)
- Status Is Down: When ‘Down’ Is Not ‘Gone’: Designing Graceful Degradation for Concentrated Digital Dependencies