Q3 2026 Outage Report: The Hidden Dependencies Behind Visible Disruption
An outage can begin in one place and be experienced somewhere quite different. A cooling problem at a data centre can reach email, VPN and payments; an authentication configuration can reach several workplace applications; a telecommunications fault can interrupt the path to emergency services. Those are not interchangeable failures, and their timing does not suggest a shared cause. But the disruptions Status Is Down followed in Q3 2026 show why the useful question is not simply “Is it down?” It is which customer task failed, through which dependency, and when did that task actually recover?
This report uses two distinct SID evidence sets. A repository snapshot contains 1,765 distinct community-topic URLs dated in July; these are discussion or monitoring leads, not 1,765 verified outages or 1,765 user complaints. The publicly published News archive contains 47 source-linked SID articles dated August–September, including multi-incident articles; these are editorial selections, not 47 separate outages. Their counts are not comparable, so we do not add them into a quarterly “incident total” or claim they measure sector reliability. The live SID dashboard shows current community, validated and recovery signals, not a reconstructed historical Q3 time series.
July: a busy conversation is not a failed-service census
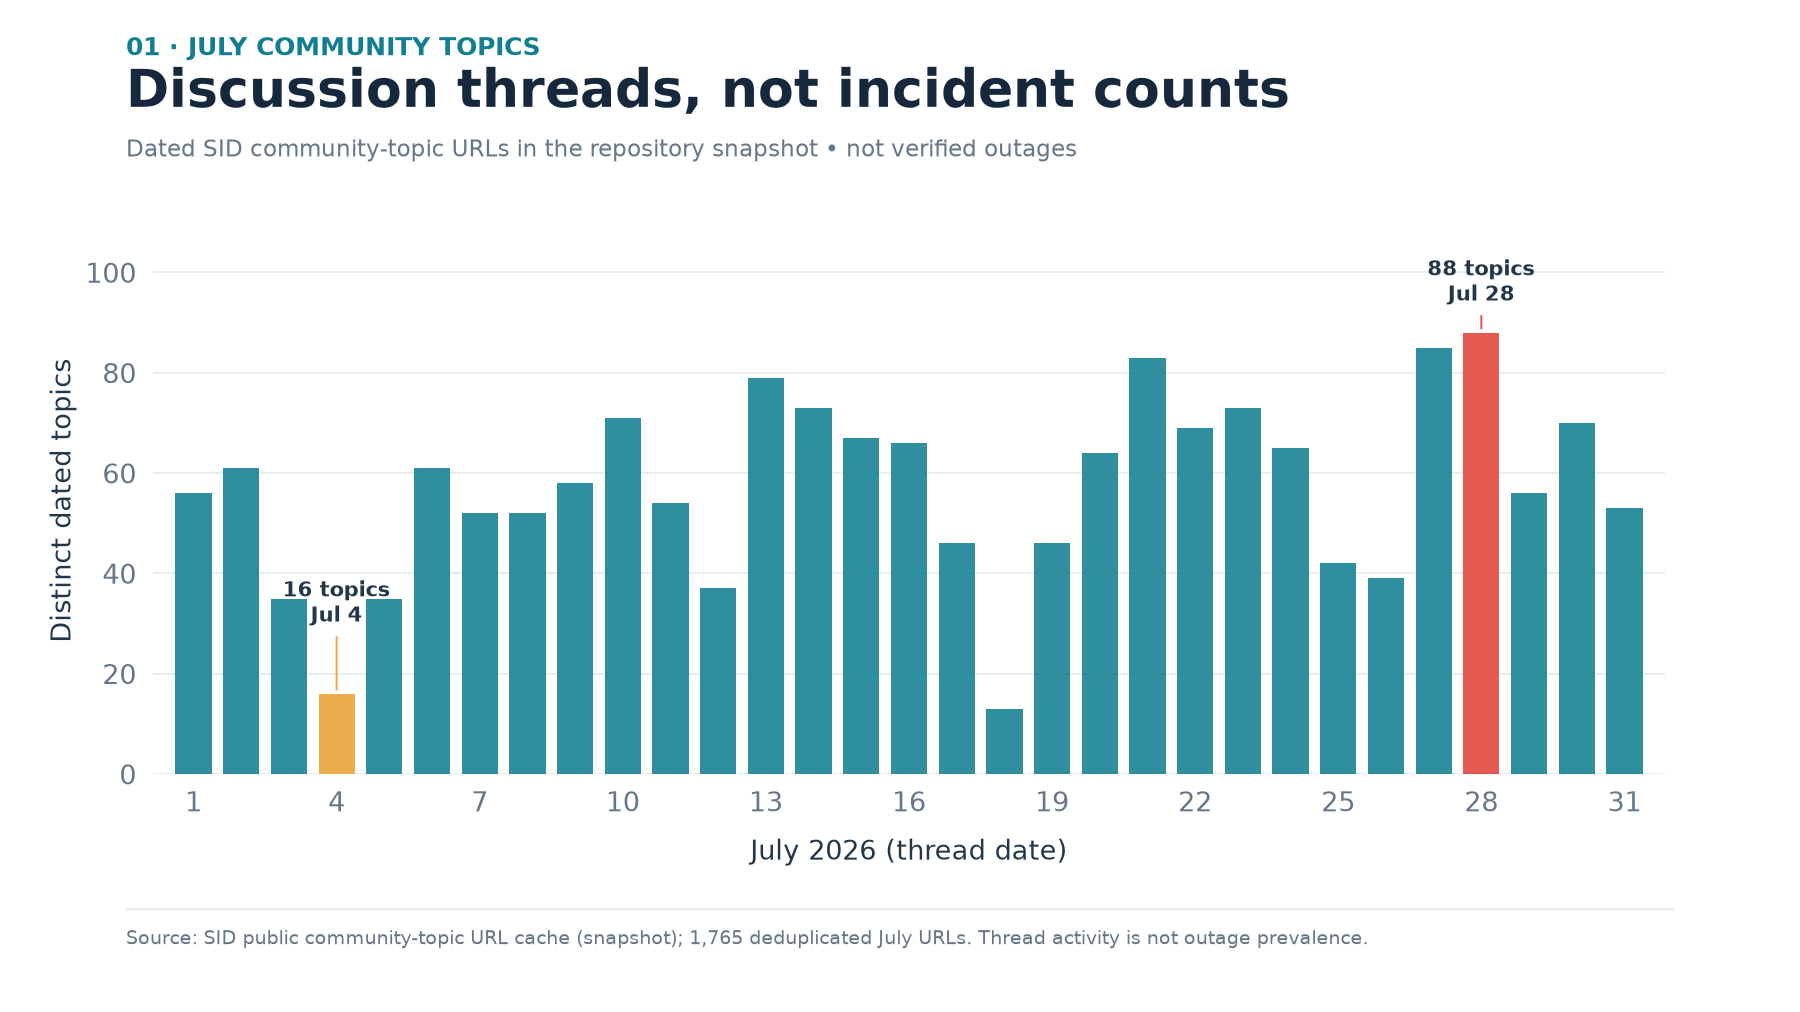
Figure 1. Distinct dated topic URLs in the available July repository snapshot, deduplicated by URL. July 4 has 16 and July 28 has 88. The metric describes published discussion threads, not independent confirmation, a service’s downtime days, or the number of affected customers. Thread date labels can differ from posting time across time zones; the snapshot need not be complete.
July’s archive is a useful triage record, but the distinction matters. A dated “Is Airtel down?” or “Is ProtonMail down?” page documents what SID invited people to discuss. It does not, by itself, prove an operator incident. The quiet-looking July 4 bar could reflect participation or publishing cadence as much as service health; the July 28 bar cannot establish that more independent systems failed. July’s two existing monthly summaries and AI-focused report give different monthly totals (1,826 and 1,814) and use a different counting approach from the archived-topic extract. Rather than choose an unsupported quarter-wide baseline, we use the July material as a signal layer and reserve specific outage conclusions for stronger operator and newsroom evidence.
What the August–September reporting actually covered

Figure 2. Manual, multi-label topic tags for the 47 published SID News articles: 22 in August and 25 in September. Power, water and energy appear in 28 articles; transport in 19; telecommunications and connectivity in 16; digital and cloud services in 14; banking and payments in seven. A roundup can be tagged more than once. These figures measure what SID covered, not the incidence, severity, duration or geographic distribution of Q3 outages.
The apparent mix is still informative about interdependence. A power disruption may also affect transport or communications; the chart allows a single report to carry both labels rather than forcing unrelated events into one causal bucket. For example, West Maui’s wind-period power report noted county warnings that prolonged electricity loss could affect cellular and internet access. That warning was contingency advice, not evidence of an island-wide telecom failure. Hawaiian Electric said approximately 10,000 West Maui customers remained without power at 7 p.m. on 27 September and that hazardous weather impeded aerial line assessment; restoration began in phases the following day, according to KHON2. The separate Pukalani safety shutoff should not be added to that West Maui count as if it were one event.
Small fault domains can reach many customer journeys
On 27 August, Proton’s incident report traced a disruption to a cooling failure in its Frankfurt data centre. Mail access, delivery-related functions, notifications and parts of the VPN experience were affected differently. Proton said most services returned for most users around 01:30 CEST, while some less-critical functions recovered later and reduced database redundancy required further work. Data Center Dynamics independently reported the incident and Proton’s explanation. SID’s Proton account illustrates the operational distinction: protecting equipment, restoring cooling, restoring applications and closing residual risk are not one timestamp. The reported maintenance and failover sequence remains Proton’s own post-incident finding, not a cause we independently established.
The Microsoft 365 disruption beginning 31 August took a different route. As BleepingComputer reported, Microsoft attributed Exchange Online authentication and email failures to a core authentication-configuration issue, with other Microsoft 365 functions affected. Microsoft’s early September updates described high availability for most users before the last reported user-impact scenarios were resolved. The ChatGPT Work incident mentioned in the same SID article was separate; coincidence is not proof of one upstream failure. Taken together, the Proton and Microsoft cases show that a visible product can fail because of a less visible environmental or identity layer, without implying that the two operators had the same root cause.
A third dependency pattern appeared in the Sharetec credit-union report. WTOC described a data-centre cooling problem and phased institution-by-institution restoration; Evansville Courier & Press reported that a credit union’s online and mobile banking remained unavailable after most other functions returned. Some institutions reported debit-card availability while others experienced card-related issues. The key unit of recovery was each institution’s tested customer workflow, not a single provider-wide “up” label. The Sharetec event had no demonstrated causal link to the separate Cuba blackout discussed in the SID article.
Connectivity can recover before service does
Vietnam’s international connectivity problems illustrate overlapping but distinct infrastructure faults. Tuoi Tre News reported three affected undersea systems in late August and an operator estimate of about 30% less aggregate international capacity, with rerouting onto unaffected paths. VnExpress International identified a fourth affected system in its later account. The difference reflects which faults and reporting window each article counted, not evidence of one simultaneous cable cut. Overseas services might be slower at peak times even where domestic routes remained usable. SID’s Vietnam coverage did not establish that all users lost internet access.
In Japan, J:COM’s restoration notice said internet service became unavailable or difficult to use in some areas on 23 September. The operator attributed the problem to high DNS-server load from external access. NHK reported broadband recovery later that day, while related customer-service access was not necessarily normal on the same timetable. The SID article also covers a separate NAB banking incident, with no asserted connection. Network restoration should be reported alongside the status of authentication, apps, customer support and other dependent tasks—not substituted for them.
Consequences differ sharply by function. A 76-minute Optus voice-network issue on 11 September affected some calls in parts of four Australian jurisdictions, including access to emergency calling, Reuters reported. ABC News described welfare checks and said regulators would investigate. That does not show that every mobile customer was disconnected or that the final technical root cause had been settled. The SID report covered an unrelated California safety-shutoff story separately. For critical communications, which calling path failed and which alternatives worked matter more than a broad “mobile down” label.
Payment recovery must be measured at checkout
A 15 August Mastercard-related payment disruption reached several processors, but their posted states were not identical at the same instant. SID’s processor-by-processor report captured card authorization or decline problems while some routes were already processing again. Later, ABC News Australia reported Mastercard’s statement that a scheduled system update caused temporary declines and that systems had returned to normal. Those statements represent different update times, not necessarily a contradiction. They do not prove that all banks, merchants or locations had the same impact. An earlier Worldpay event on 11 August should also not be merged into the 15 August incident.
On 30 September, the GCash app was unavailable for a period in the morning, and the operator later said service was fully restored, according to GMA News and ABS-CBN News. The reports do not establish an identical technical explanation: GMA says the company did not elaborate, while another outlet reported scheduled maintenance. SID’s GCash feature correctly keeps the separate Thames Water main break apart. A responsible monitoring view distinguishes observed inability to complete a payment, operator-reported restoration and independently verified downstream normalisation.
The Q3 lesson: report the service outcome and its confidence
Uptime Institute’s 2026 analysis found that per-site outage frequency in its own research continued to decline, while external infrastructure and connectivity featured more prominently among publicly reported outages. That external study has different sources and a different sampling frame from SID’s Q3 material. It supports scrutiny of dependencies, not a claim that SID measured a worldwide quarterly increase.
For operators, the practical reporting sequence is to distinguish signal, corroborated incident, affected customer task, workaround, component restoration, and verified return to normal. For readers, a live status view is most useful alongside first-party advisories and the original newsroom reporting—especially when a support line, bank card route, emergency call or transport connection can have a different state from the main application. SID’s real-time analysis, service directory and Reports archive can help teams follow those changing signals. Organisations that want to track services and websites they rely on can review Status Is Down plans and sign up for coverage matched to their dependencies.
Method note. The archived July topic count was extracted from SID’s cached public community-topic URLs, restricted to July-dated titles or ISO publication dates and deduplicated by URL. The 47 August–September records are public WordPress News-category posts by publication date (not necessarily incident date); labels were assigned to article topics, so a multi-incident article can appear in more than one bar. The available archive does not prove that July topic collection is complete or allow comparable August and September community counts. Older July summaries use differing totals and definitions. No figure here estimates worldwide outage frequency, provider reliability, customer impact, severity, or a causal share. Incident descriptions above instead cite operator statements and independent reports near each claim; later postmortems may revise them.
Selected primary and independent reporting
- Proton’s August 27 incident report and Data Center Dynamics
- BleepingComputer on Microsoft Exchange Online and Microsoft 365
- WTOC on Sharetec-linked credit-union disruption and Evansville Courier & Press on restoration
- Tuoi Tre News and VnExpress International on Vietnam’s distinct cable faults
- J:COM’s outage notice and NHK’s restoration report
- Reuters and ABC News Australia on Optus emergency-call effects
- ABC News Australia on Mastercard and GMA News on GCash
- Maui County’s preparedness guidance and KHON2 on phased West Maui restoration
- Uptime Institute’s 2026 annual outage analysis
Image credit: Illustration generated for Status Is Down